● untrappable Scam Pulse · September 2026 release
Scam statistics 2026: untrappable Scam Pulse
By untrappable · First published July 16, 2026 · Updated September 8, 2026
A dated view of reported scam losses, contact methods and our editorial coverage. FTC and FBI IC3 data stay separate. The calculations below support year-to-year comparisons, not claims about how often scams happen or how they changed this month.
Monthly change in how scammers make contact and what they ask for: insufficient data. This release sets a baseline anyone can check. It doesn't publish private messages or treat our own catalog of guides as a count of incidents.
US and international complaints; not a US-only total.
Source: FBI IC3 · 2025 Internet Crime ReportRounded reported losses; a separate reporting system.
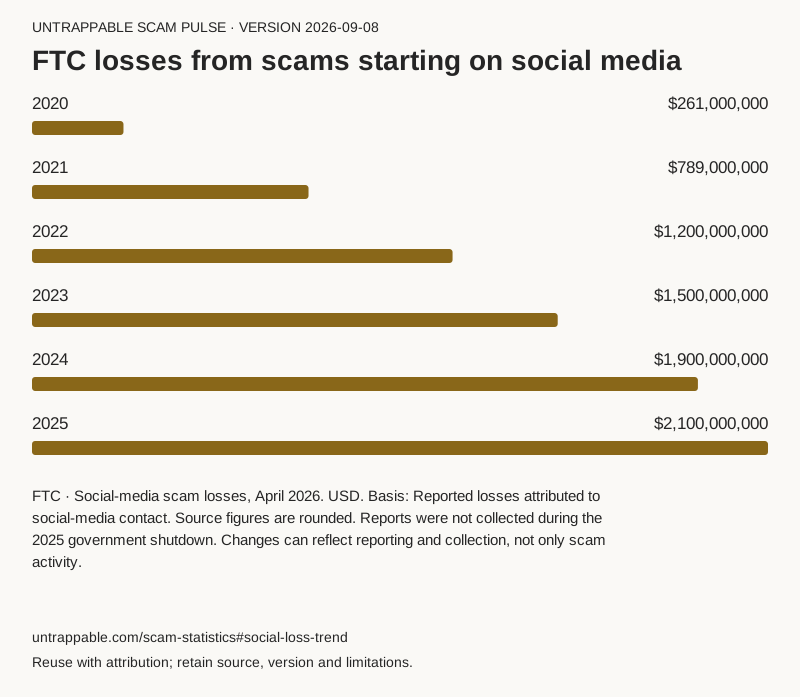
Source: FTC · Social-media scam losses, April 20262024 to 2025, calculated from rounded social-media loss totals.
Source: FTC · Social-media scam losses, April 2026September 8 snapshot; not a sample of monthly incidents.
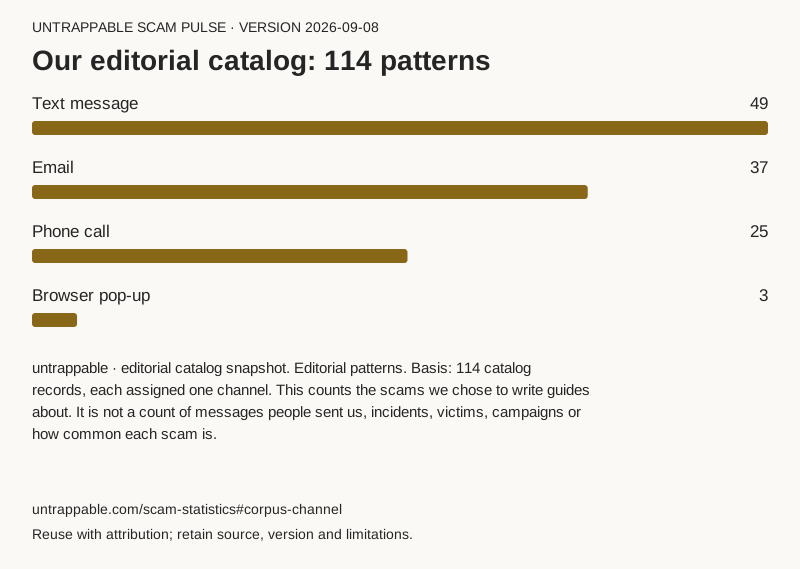
Source: untrappable · editorial catalog snapshotCite this page
untrappable. (2026). Scam statistics 2026: untrappable Scam Pulse. Version 2026-09-08. https://untrappable.com/scam-statistics
Key findings
Source facts, our calculations and the gaps in our own evidence.
- 1,008,597
IC3's 2025 complaint count includes US and international reports. It is not a count of unique victims.
Source: FBI IC3 · 2025 Internet Crime Report - ≈10.5%
Our calculation: (2025 social-media losses ÷ 2024 losses − 1) × 100. Rounded inputs of $2.1B and $1.9B support an approximate annual change, not a monthly trend.
Source: FTC · Social-media scam losses, April 2026 - Denominators matter
FTC contact shares here cover loss reports with a known contact method. They cannot tell you which channel reaches the most people.
Source: FTC · Social-media scam losses, April 2026 - 0 public samples
We have no sample of real scam messages submitted by the public for this release. The catalog chart counts our own guides, so it can't show how scam contact or requests changed in September.
Source: How we check scams and sources
The numbers, in 7 charts
Each chart uses one reporting system. Keep its source, denominator, version date and limitations when citing or reusing it.
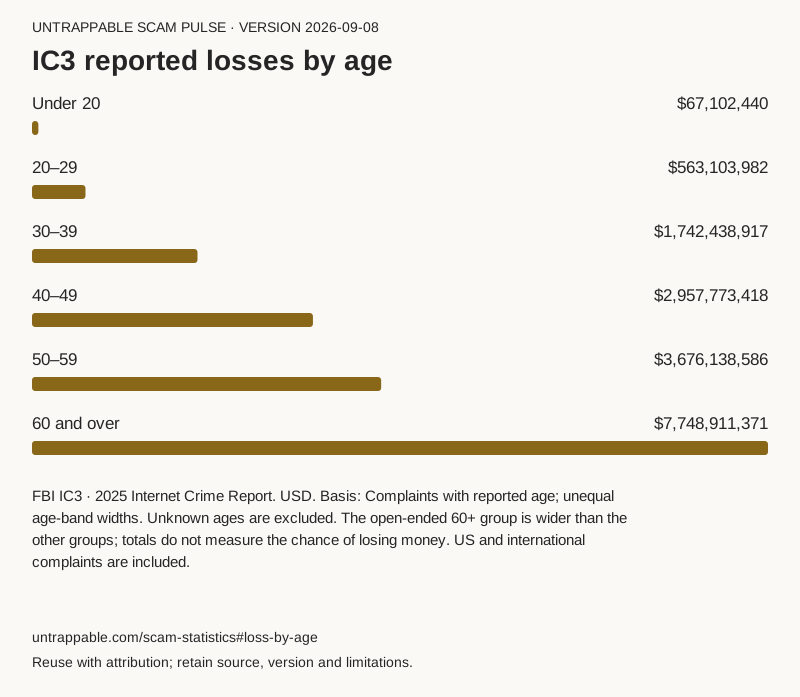
IC3 reported losses by age
2025 · total reported loss, not individual risk
- Under 20
- $67,102,440
- 20–29
- $563,103,982
- 30–39
- $1,742,438,917
- 40–49
- $2,957,773,418
- 50–59
- $3,676,138,586
- 60 and over
- $7,748,911,371
USD · Version 2026-09-08
Source: FBI IC3 · 2025 Internet Crime Report
Basis: Complaints with reported age; unequal age-band widths.
Unknown ages are excluded. The open-ended 60+ group is wider than the other groups; totals do not measure the chance of losing money. US and international complaints are included.
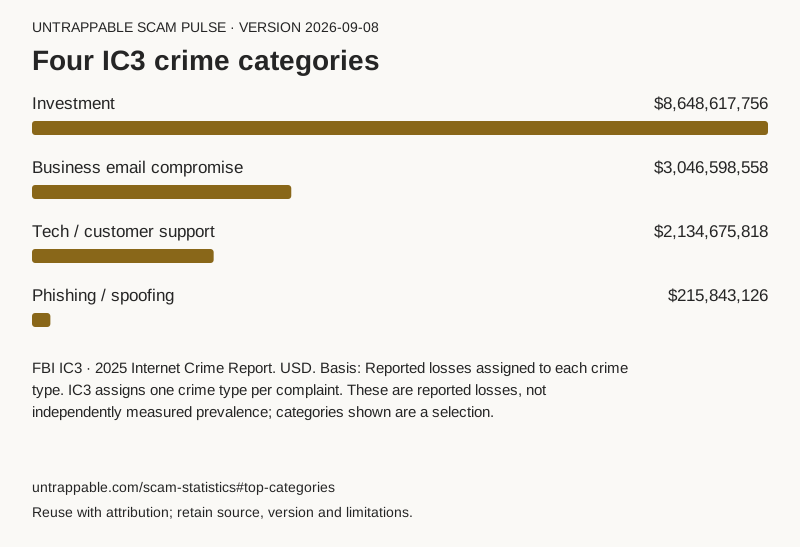
Four IC3 crime categories
2025 · selected categories, not an exhaustive ranking
- Investment
- $8,648,617,756
- Business email compromise
- $3,046,598,558
- Tech / customer support
- $2,134,675,818
- Phishing / spoofing
- $215,843,126
USD · Version 2026-09-08
Source: FBI IC3 · 2025 Internet Crime Report
Basis: Reported losses assigned to each crime type.
IC3 assigns one crime type per complaint. These are reported losses, not independently measured prevalence; categories shown are a selection.
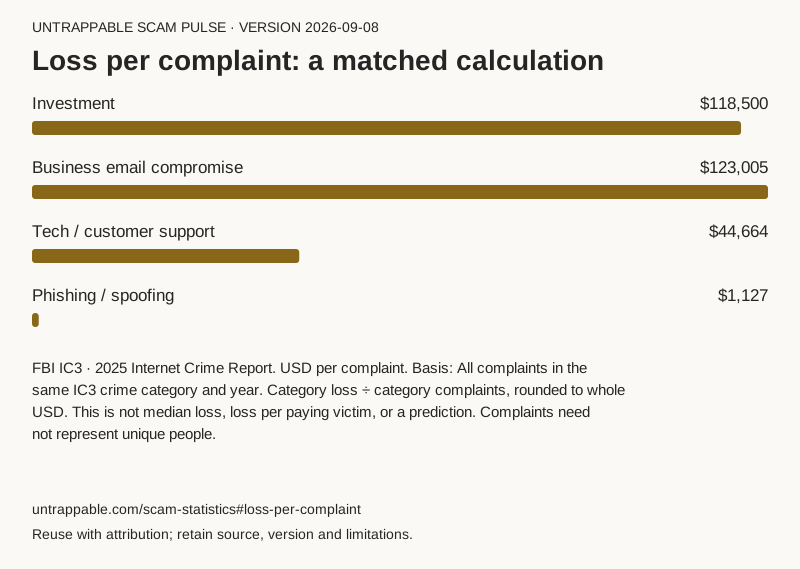
Loss per complaint: a matched calculation
untrappable calculation · IC3 2025
- Investment
- $118,500
- Business email compromise
- $123,005
- Tech / customer support
- $44,664
- Phishing / spoofing
- $1,127
USD per complaint · Version 2026-09-08
Source: FBI IC3 · 2025 Internet Crime Report
Basis: All complaints in the same IC3 crime category and year.
Category loss ÷ category complaints, rounded to whole USD. This is not median loss, loss per paying victim, or a prediction. Complaints need not represent unique people.
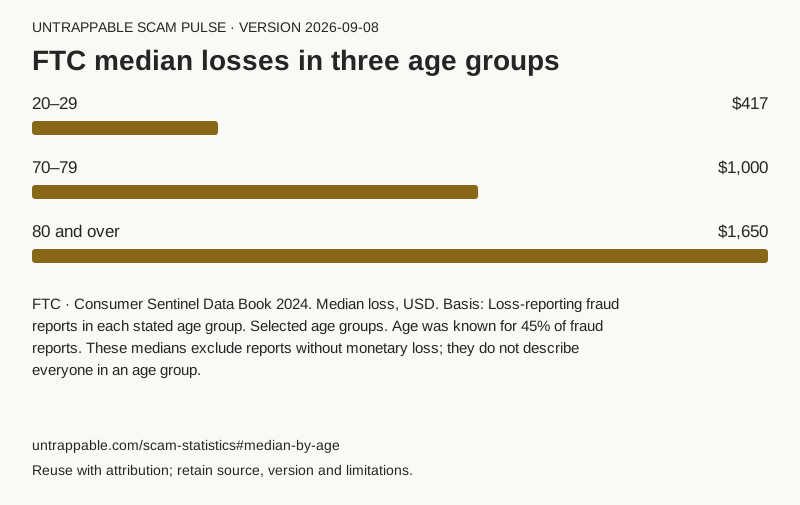
FTC median losses in three age groups
2024 · fraud reports with monetary loss and age information
- 20–29
- $417
- 70–79
- $1,000
- 80 and over
- $1,650
Median loss, USD · Version 2026-09-08
Source: FTC · Consumer Sentinel Data Book 2024
Basis: Loss-reporting fraud reports in each stated age group.
Selected age groups. Age was known for 45% of fraud reports. These medians exclude reports without monetary loss; they do not describe everyone in an age group.
FTC losses from scams starting on social media
2020–2025 · rounded source figures
- 2020
- $261,000,000
- 2021
- $789,000,000
- 2022
- $1,200,000,000
- 2023
- $1,500,000,000
- 2024
- $1,900,000,000
- 2025
- $2,100,000,000
USD · Version 2026-09-08
Source: FTC · Social-media scam losses, April 2026
Basis: Reported losses attributed to social-media contact.
Source figures are rounded. Reports were not collected during the 2025 government shutdown. Changes can reflect reporting and collection, not only scam activity.
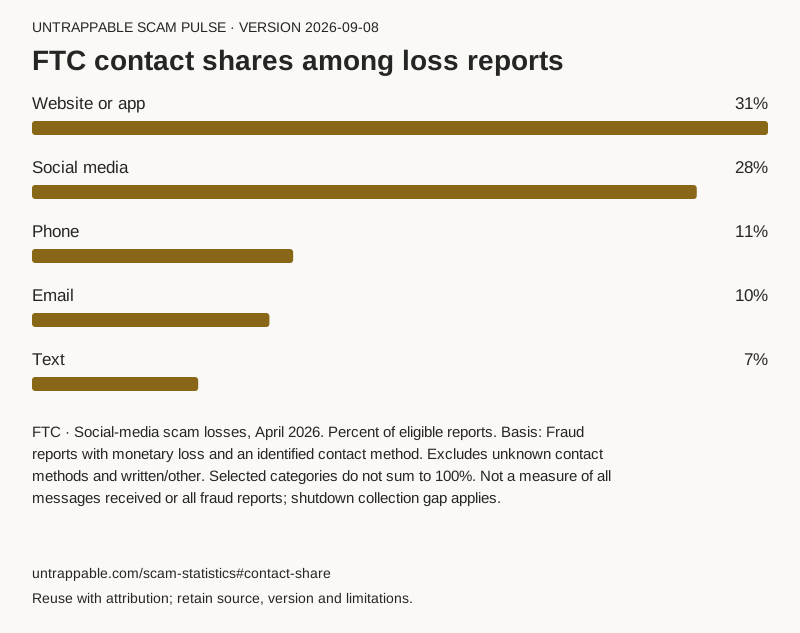
FTC contact shares among loss reports
2025 · selected contact methods
- Website or app
- 31%
- Social media
- 28%
- Phone
- 11%
- 10%
- Text
- 7%
Percent of eligible reports · Version 2026-09-08
Source: FTC · Social-media scam losses, April 2026
Basis: Fraud reports with monetary loss and an identified contact method.
Excludes unknown contact methods and written/other. Selected categories do not sum to 100%. Not a measure of all messages received or all fraud reports; shutdown collection gap applies.
Our editorial catalog: 114 patterns
Snapshot 2026-09-08 · convenience sample
- Text message
- 49
- 37
- Phone call
- 25
- Browser pop-up
- 3
Editorial patterns · Version 2026-09-08
Source: untrappable · editorial catalog snapshot
Basis: 114 catalog records, each assigned one channel.
This counts the scams we chose to write guides about. It is not a count of messages people sent us, incidents, victims, campaigns or how common each scam is.
What changed—and where to go next
The FTC social-media series adds a 2025 annual comparison. It does not establish a September surge. For an unexpected social message, use the social impersonation guide before following a request.
The IC3 calculation distinguishes complaint volume from loss per complaint. For a package or account alert, start with the message checker; it identifies signals, not proof that a message is safe.
Voice, video and support-search requests cannot be judged by these totals. Use the voice impersonation guide or support impersonation guide for independent checks. If you shared access, a code or money, go to recovery steps for what happened.
Methodology
Versioned inputs and reproducible calculations
Version 2026-09-08 uses figures copied by hand from the agencies' published tables and the FTC's social-media data spotlight. Where each figure comes from, and how precise it is, is listed below. Every chart and calculation can be checked against the downloadable CSV. These are published figures, not a live dashboard.
Separate reporting systems
The FTC and IC3 collect different reports over different periods, and the same scam can appear in both, so never add their totals together. Neither is a survey of the whole population or a verified count of all fraud. IC3 explains how it removes duplicates and adjusts losses in Appendix C. Because many scams go unreported and some reports contain errors, the totals aren't a strict minimum either.
Source facts, calculations and observations
Dollar values, medians and contact percentages come straight from the agencies' tables. We calculate loss per complaint and the approximate annual change from matching figures. The 114-pattern catalog counts the scam guides we had published on September 8, 2026; it is not a count of incidents. We have no sample of scam messages submitted by the public for this release, so there isn't enough data to show monthly changes in what scammers ask for.
Accountability and reuse
untrappable is responsible for this report and its methods. Reuse our original charts and aggregate calculations with attribution, the version date and a link to this report; keep source labels and limitations intact. Underlying agency data remains subject to its own terms. See our methodology and commercial policy and about page. Send corrections through our contact page, naming the chart and source row.
Source register
All figures reviewed September 8, 2026; source links rechecked September 15, 2026. Each source covers a different period. The annual tables had not changed.
FBI IC3 · 2025 Internet Crime Report
- Coverage and geography
- 2025 · US and international complaints
- Source locator
- Printed pages 6–8; methodology, Appendix C
- Input precision
- Tables: whole USD and complaints; headline: rounded billions
FTC · Consumer Sentinel Data Book 2024
- Coverage and geography
- 2024 · Consumer Sentinel reports; includes international contributors
- Source locator
- Printed page 13, age and fraud-loss table
- Input precision
- Published median, whole USD
FTC · Social-media scam losses, April 2026
- Coverage and geography
- 2020–2025 losses; 2025 contact shares · Consumer Sentinel reports; not a population survey
- Source locator
- Figure and footnotes 1–2
- Input precision
- Rounded USD and whole percentage points
untrappable · editorial catalog snapshot
- Coverage and geography
- 2026-09-08 · Editorial selection; no population geography
- Source locator
- Scam guides published on untrappable.com, counted by channel
- Input precision
- Exact catalog counts at this version
Version history and corrections
July 16, 2026: initial statistics report.
September 8, 2026: versioned inputs, exact IC3 table values, matched calculations, current FTC social-media data, safe CSV and reusable chart images. Corrected US-only framing of IC3 totals and wording that compared FTC and IC3 figures directly; replaced the outdated catalog count and unsupported age-risk conclusions.
The earlier FCC call-type aggregation and BBB claims were removed because this release could not reproduce their supporting source snapshot. The former FCC chart anchor remains here to explain the correction.
September 15, 2026: source-URL recheck. IC3 2025 and FTC 2024 figures unchanged. There is still not enough data to show monthly changes in how scammers make contact or what they ask for.
Found an error? Contact untrappable with the chart, version and primary-source locator. Next scheduled evidence review: October 8, 2026.
Sources
- 01FBI IC3 · 2025 Internet Crime Report— FBI Internet Crime Complaint Center
- 02FTC · Consumer Sentinel Data Book 2024— Federal Trade Commission
- 03FTC · Social-media scam losses, April 2026— Federal Trade Commission
- 04untrappable · editorial catalog snapshot— untrappable
Frequently asked
Can I add FTC and IC3 reported losses together?
Does this measure how scams changed this month?
Is loss per complaint the typical victim's loss?
Can I reuse these charts?
Sourced, not guessed
Every guide cites the agencies and companies that documented the scam, listed at the foot of each page.
Calm by design
No countdown timers, no scare imagery, no pressure. You get the verdict and the next step.
Private checking
The checker runs in your browser. What you paste is never uploaded or stored.


Recognize one of these in your own inbox or messages? See the 114 scam patterns we've documented for the exact tells and what to do, or start with the free steps to protect yourself.